Table of Contents
Is Gold Giving Bullish Signals for 2025?
Gold has long been considered a safe-haven asset, and recent price action has caught the attention of technical analysts. A closer look at the Gold:USD chart reveals a potential confluence of bullish chart patterns, suggesting a possible upward trend for 2025. Let’s delve into these patterns and what they could mean for gold’s future. A Confluence of Bullish Signals for Gold?
Cup and Handle
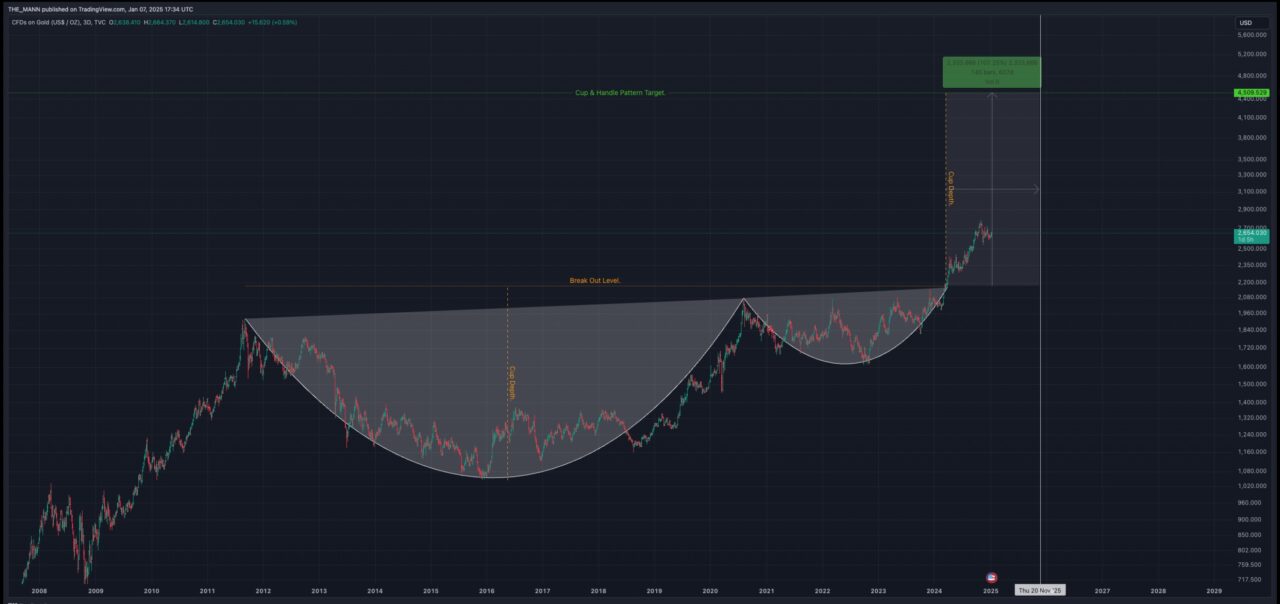
One prominent pattern is a potential cup and handle formation. This pattern resembles a ‘U’ shape (the cup) followed by a short downward drift (the handle). This pattern suggests that after a period of consolidation, buyers are stepping back in, potentially driving the price higher. A breakout above the handle’s resistance level would confirm this bullish signal.
Inverse Head and Shoulders
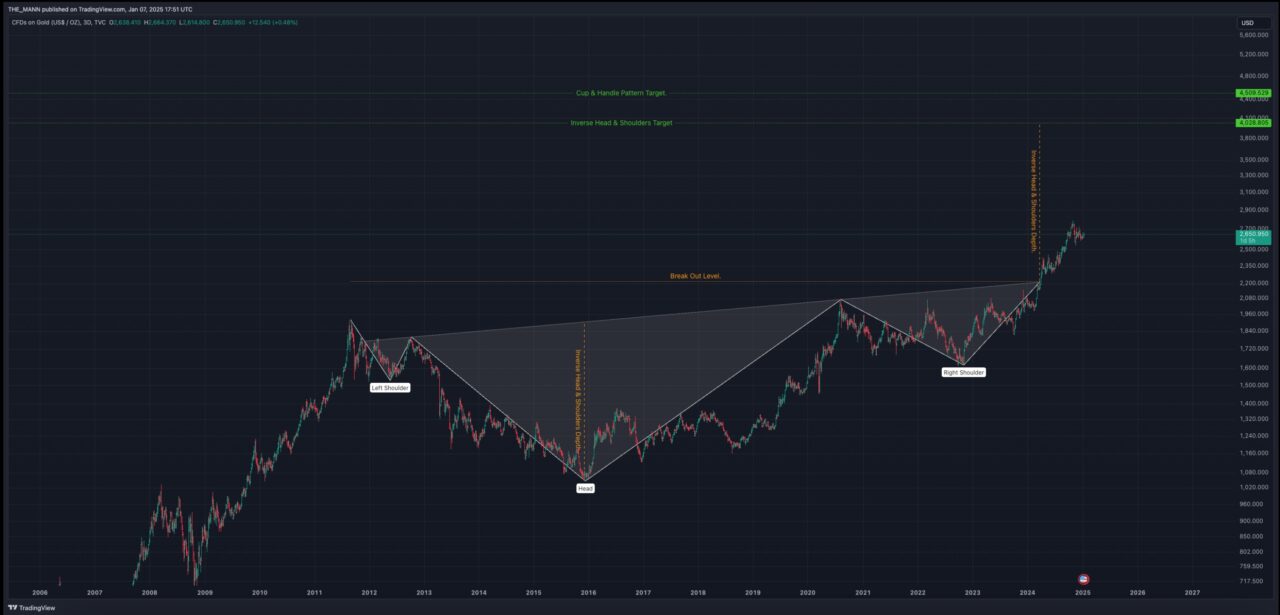
Adding to the bullish sentiment, an inverse head and shoulders pattern may also be forming. This pattern, characterized by three troughs with the middle one (the head) being the lowest, signals a potential reversal of a downtrend. A break above the neckline of this pattern would further strengthen the case for a bullish reversal.
This post is by Guest Blogger ‘Dumb Bros’. Follow on X here
Fibonacci Retracement
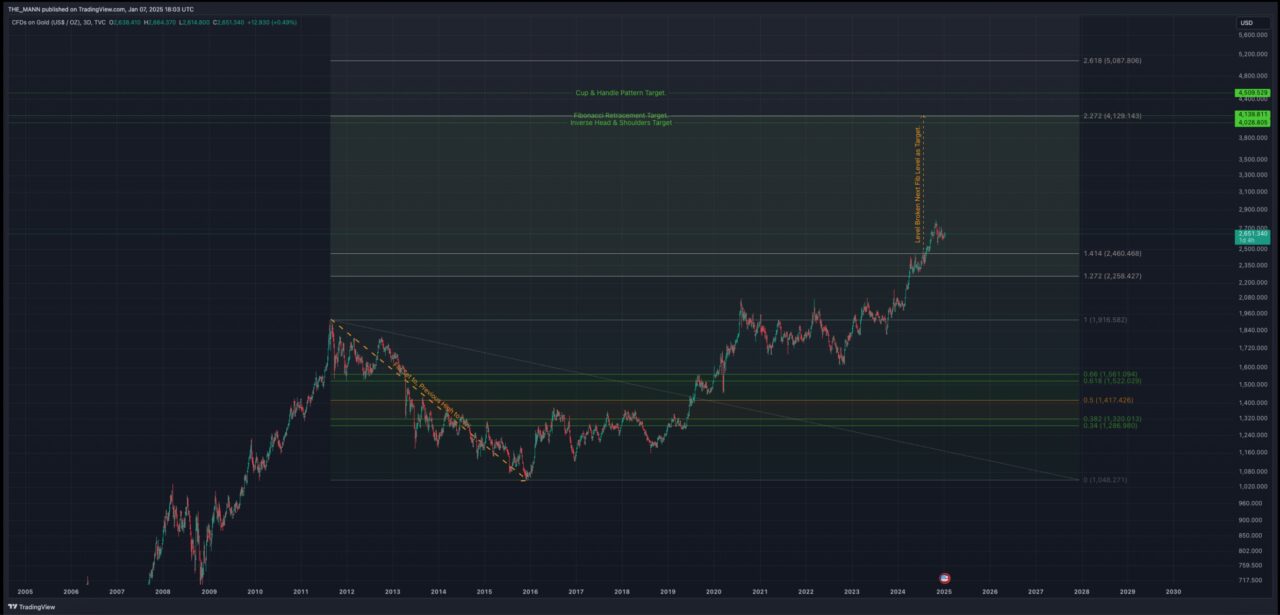
Fibonacci retracement levels can help us identify potential support and resistance areas. By applying Fibonacci ratios to recent price swings in gold, we can see how the price has interacted with these key levels. These levels can provide potential targets for both bullish and bearish scenarios.
Ascending Channel
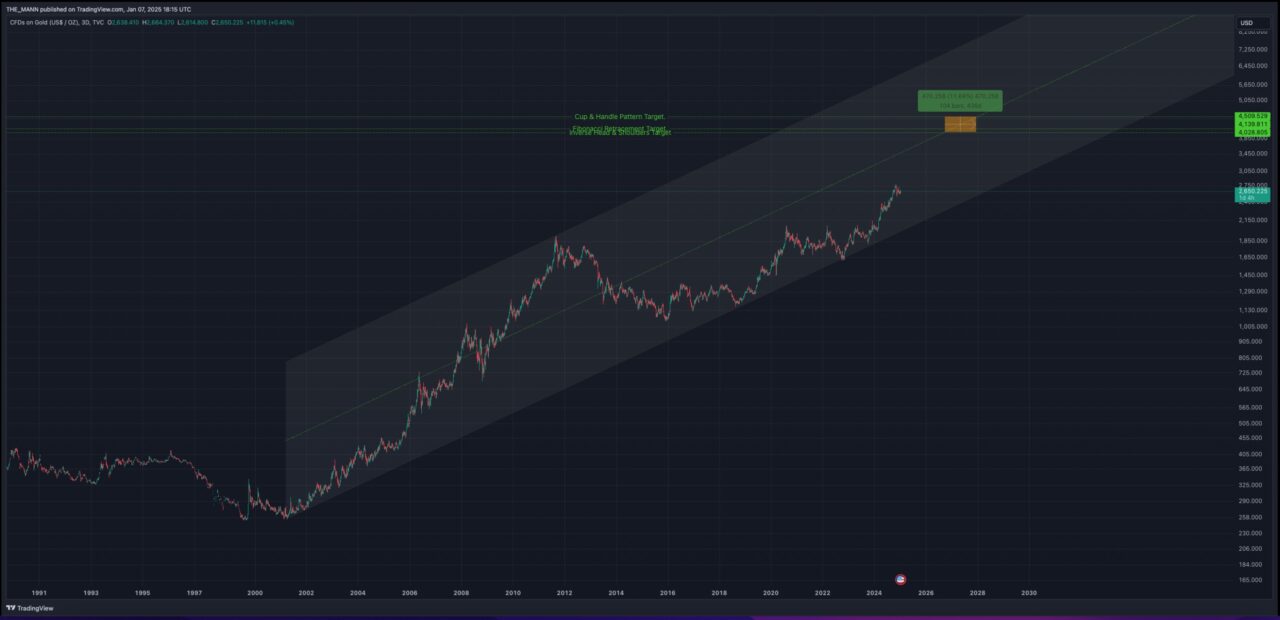
Finally, an ascending channel might be forming, defined by two upward-sloping parallel trend-lines. This pattern indicates a consistent uptrend, with the price oscillating between the two trend lines. However, it’s crucial to watch for a potential break below the lower trend-line, which could signal a trend reversal.
So what does the future hold for Gold?
The presence of these multiple Gold bullish 2025 chart patterns on the Gold:USD chart suggests a potential upward trend. However, it’s essential to remember that technical analysis is not a foolproof predictor of future price movements. It’s crucial to consider other factors, such as macroeconomic conditions and geopolitical events, when making investment decisions. Always conduct thorough research and consult with a financial advisor before making any investment decisions.
This article is for informational purposes only and does not constitute financial advice. Investing in precious metals involves risks, and past performance does not guarantee future results.
This post is by guest blogger Dumb Bros and has been collated by Gold and Silver UK.
You can follow Dumb Bros on X here.
Follow Gold and Silver UK on X here.
Some concise definitions and explanations of these chart patterns:
1. Cup and Handle:
- Definition: A bullish continuation pattern resembling a cup with a handle. The “cup” is a U-shaped price consolidation, while the “handle” is a short, downward drift before a breakout.
- Article Detail: The cup represents a period of price decline followed by a recovery to roughly the starting level. The handle is a smaller consolidation, often a flag or pennant, that precedes the breakout. The breakout above the handle’s resistance line signals a resumption of the prior uptrend. Volume typically increases during the breakout.
- Visual Aid Suggestion: A chart showing a clear cup and handle pattern with labeled components. – C&H Image – C&H ARTICLE
2. Inverse Head and Shoulders:
- Definition: A bullish reversal pattern signaling the end of a downtrend. It resembles a head with two lower shoulders.
- Article Detail: The “head” is the lowest point of the downtrend. The “shoulders” are higher lows on either side of the head. A “neckline” connects the highs between the head and shoulders. A break above the neckline confirms the pattern and suggests a trend reversal.
- Visual Aid Suggestion: A chart illustrating the inverse head and shoulders pattern with labeled head, shoulders, and neckline. IH&S Image – IH&S Article
3. Fibonacci Retracement:
- Definition: A tool used to identify potential support and resistance levels based on Fibonacci ratios (23.6%, 38.2%, 50%, 61.8%, 78.6%).
- Article Detail: After a significant price move (either up or down), the price often retraces a portion of that move. Fibonacci retracement levels are used to predict where the price might find support during a retracement in an uptrend or resistance during a retracement in a downtrend.
- Visual Aid Suggestion: A chart with Fibonacci retracement levels drawn over a price swing, highlighting how the price interacts with these levels. – FIB Retrace ment Image – FIB Retrace ment Article
4. Ascending Channel:
- Definition: A bullish pattern defined by two upward-sloping parallel trendlines. The price oscillates between these lines.
- Explanation: This pattern suggests that the price is in an uptrend, with higher highs and higher lows. However, a break below the lower trendline can signal a trend reversal.
- Visual Aid: Imagine two upward sloping parallel lines containing a price moving within them. AC Image – AC Article

